Quickstart
Simple example
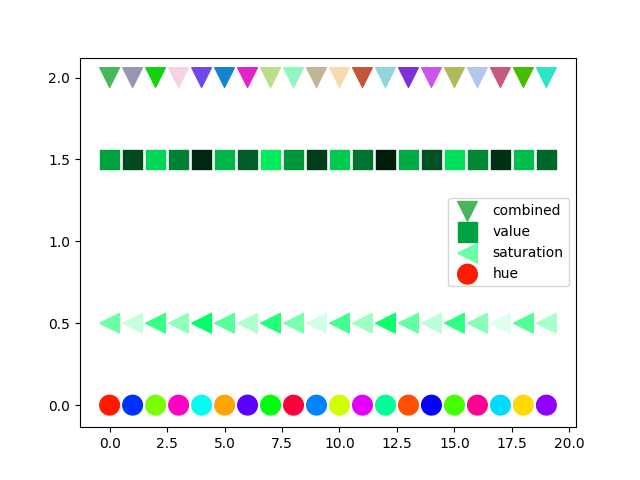
from matplotlib import pyplot as plt
from colorseq import DistinctColors

dc_h = DistinctColors(20, (0.0, 1.0), 1.0, 1.0)
dc_s = DistinctColors(20, 0.4, (0.1, 1.0), 1.0)
dc_v = DistinctColors(20, 0.4, 1.0, (0.1, 1.0))
dc_comb = DistinctColors(
        20, (0.0, 1.0), (0.1, 1.0), (0.7, 1.0),
        h_shuffle=True, s_shuffle=True, v_shuffle=True
        )
colors_h = dc_h.get_colors()
colors_s = dc_s.get_colors()
colors_v = dc_v.get_colors()
colors_comb = dc_comb.get_colors()
fig, ax = plt.subplots()
ax.scatter(
        [*range(20)], [2 for _ in range(20)], s=200.0,
        c=colors_comb, marker='v', label='combined'
        )
ax.scatter(
        [*range(20)], [1.5 for _ in range(20)], s=200.0,
        c=colors_v, marker='s', label='value'
        )
ax.scatter(
        [*range(20)], [0.5 for _ in range(20)],
        s=200.0, c=colors_s, marker='<', label='saturation'
        )
ax.scatter(
        [*range(20)], [0 for _ in range(20)], s=200.0,
        c=colors_h, label='hue'
        )
ax.legend(loc='best', numpoints=4)
plt.show()
Click here to download this
script.
Installation
You can get the latest version with
pip install --upgrade --no-deps git+https://github.com/j-i-l/ColorSequence.git
